matplotlib.axes.Axes.scatter
-
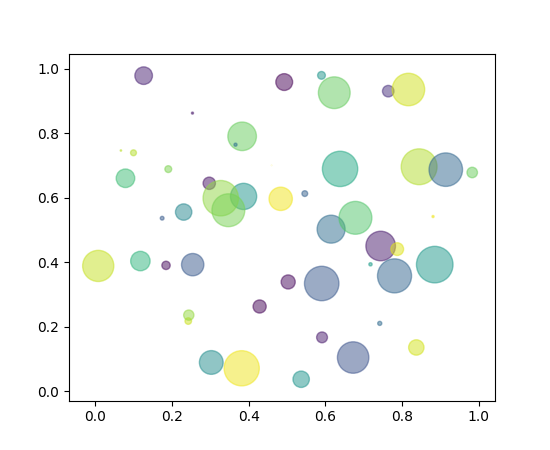
Axes.scatter(x, y, s=None, c=None, marker=None, cmap=None, norm=None, vmin=None, vmax=None, alpha=None, linewidths=None, verts=None, edgecolors=None, **kwargs) -
Make a scatter plot of
xvsyMarker size is scaled by
sand marker color is mapped tocParameters: x, y : array_like, shape (n, )
Input data
s : scalar or array_like, shape (n, ), optional
size in points^2. Default is
rcParams['lines.markersize'] ** 2.c : color, sequence, or sequence of color, optional, default: ‘b’
ccan be a single color format string, or a sequence of color specifications of lengthN, or a sequence ofNnumbers to be mapped to colors using thecmapandnormspecified via kwargs (see below). Note thatcshould not be a single numeric RGB or RGBA sequence because that is indistinguishable from an array of values to be colormapped.ccan be a 2-D array in which the rows are RGB or RGBA, however, including the case of a single row to specify the same color for all points.marker :
MarkerStyle, optional, default: ‘o’See
markersfor more information on the different styles of markers scatter supports.markercan be either an instance of the class or the text shorthand for a particular marker.cmap :
Colormap, optional, default: NoneA
Colormapinstance or registered name.cmapis only used ifcis an array of floats. If None, defaults to rcimage.cmap.norm :
Normalize, optional, default: NoneA
Normalizeinstance is used to scale luminance data to 0, 1.normis only used ifcis an array of floats. IfNone, use the defaultnormalize().vmin, vmax : scalar, optional, default: None
vminandvmaxare used in conjunction withnormto normalize luminance data. If either areNone, the min and max of the color array is used. Note if you pass anorminstance, your settings forvminandvmaxwill be ignored.alpha : scalar, optional, default: None
The alpha blending value, between 0 (transparent) and 1 (opaque)
linewidths : scalar or array_like, optional, default: None
If None, defaults to (lines.linewidth,).
verts : sequence of (x, y), optional
If
markeris None, these vertices will be used to construct the marker. The center of the marker is located at (0,0) in normalized units. The overall marker is rescaled bys.edgecolors : color or sequence of color, optional, default: None
If None, defaults to ‘face’
If ‘face’, the edge color will always be the same as the face color.
If it is ‘none’, the patch boundary will not be drawn.
For non-filled markers, the
edgecolorskwarg is ignored and forced to ‘face’ internally.Returns: paths :
PathCollectionOther Parameters: kwargs :
CollectionpropertiesSee also
-
plot - to plot scatter plots when markers are identical in size and color
Notes
- The
plotfunction will be faster for scatterplots where markers don’t vary in size or color. -
Any or all of
x,y,s, andcmay be masked arrays, in which case all masks will be combined and only unmasked points will be plotted.Fundamentally, scatter works with 1-D arrays;
x,y,s, andcmay be input as 2-D arrays, but within scatter they will be flattened. The exception isc, which will be flattened only if its size matches the size ofxandy.
Examples
(Source code, png, pdf)
Note
In addition to the above described arguments, this function can take a data keyword argument. If such a data argument is given, the following arguments are replaced by data[<arg>]:
- All arguments with the following names: ‘c’, ‘color’, ‘edgecolors’, ‘facecolor’, ‘facecolors’, ‘linewidths’, ‘s’, ‘x’, ‘y’.
-
© 2012–2017 Matplotlib Development Team. All rights reserved.
Licensed under the Matplotlib License Agreement.
http://matplotlib.org/2.0.2/api/_as_gen/matplotlib.axes.Axes.scatter.html