matplotlib.axes.Axes.axhspan
-
Axes.axhspan(ymin, ymax, xmin=0, xmax=1, **kwargs) -
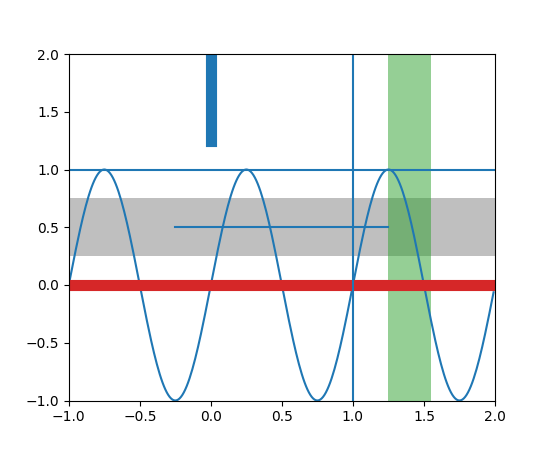
Add a horizontal span (rectangle) across the axis.
Draw a horizontal span (rectangle) from ymin to ymax. With the default values of xmin = 0 and xmax = 1, this always spans the xrange, regardless of the xlim settings, even if you change them, e.g., with the
set_xlim()command. That is, the horizontal extent is in axes coords: 0=left, 0.5=middle, 1.0=right but the y location is in data coordinates.Parameters: ymin : float
Lower limit of the horizontal span in data units.
ymax : float
Upper limit of the horizontal span in data units.
xmin : float, optional, default: 0
Lower limit of the vertical span in axes (relative 0-1) units.
xmax : float, optional, default: 1
Upper limit of the vertical span in axes (relative 0-1) units.
Returns: Polygon :
PolygonOther Parameters: kwargs :
Polygonproperties.Property Description agg_filterunknown alphafloat or None animated[True | False] antialiasedor aa[True | False] or None for default axesan Axesinstancecapstyle[‘butt’ | ‘round’ | ‘projecting’] clip_boxa matplotlib.transforms.Bboxinstanceclip_on[True | False] clip_path[ ( Path,Transform) |Patch| None ]colormatplotlib color spec containsa callable function edgecoloror ecmpl color spec, None, ‘none’, or ‘auto’ facecoloror fcmpl color spec, or None for default, or ‘none’ for no color figurea matplotlib.figure.Figureinstancefill[True | False] gidan id string hatch[‘/’ | ‘\’ | ‘|’ | ‘-‘ | ‘+’ | ‘x’ | ‘o’ | ‘O’ | ‘.’ | ‘*’] joinstyle[‘miter’ | ‘round’ | ‘bevel’] labelstring or anything printable with ‘%s’ conversion. linestyleor ls[‘solid’ | ‘dashed’, ‘dashdot’, ‘dotted’ | (offset, on-off-dash-seq) | '-'|'--'|'-.'|':'|'None'|' '|'']linewidthor lwfloat or None for default path_effectsunknown picker[None|float|boolean|callable] rasterized[True | False | None] sketch_paramsunknown snapunknown transformTransforminstanceurla url string visible[True | False] zorderany number See also
-
axvspan - Add a vertical span (rectangle) across the axes.
Examples
(Source code, png, pdf)
-
© 2012–2017 Matplotlib Development Team. All rights reserved.
Licensed under the Matplotlib License Agreement.
http://matplotlib.org/2.0.2/api/_as_gen/matplotlib.axes.Axes.axhspan.html