Debugging
There are a number of ways to debug code in Elixir. In this chapter we will cover some of the more common ways of doing so.
IO.inspect/2
What makes IO.inspect(item, opts \\ []) really useful in debugging is that it returns the item argument passed to it without affecting the behavior of the original code. Let’s see an example.
(1..10)
|> IO.inspect
|> Enum.map(fn x -> x * 2 end)
|> IO.inspect
|> Enum.sum
|> IO.inspect
Prints:
1..10
[2, 4, 6, 8, 10, 12, 14, 16, 18, 20]
110
As you can see IO.inspect/2 makes it possible to “spy” on values almost anywhere in your code without altering the result, making it very helpful inside of a pipeline like in the above case.
IO.inspect/2 also provides the ability to decorate the output with a label option. The label will be printed before the inspected item:
[1, 2, 3]
|> IO.inspect(label: "before")
|> Enum.map(&(&1 * 2))
|> IO.inspect(label: "after")
|> Enum.sum
Prints:
before: [1, 2, 3]
after: [2, 4, 6]
It is also very common to use IO.inspect/2 with binding(), which returns all variable names and their values:
def some_fun(a, b, c) do
  IO.inspect binding()
  ...
end
When some_fun/3 is invoked with :foo, "bar", :baz it prints:
[a: :foo, b: "bar", c: :baz]
Please see IO.inspect/2 to read more about other ways in which one could use this function. Also, in order to find a full list of other formatting options that one can use alongside IO.inspect/2, see Inspect.Opts.
IEx.pry/0 and IEx.break!/2
While IO.inspect/2 is static, Elixir’s interactive shell provides more dynamic ways to interact with debugged code.
The first one is with IEx.pry/0 which we can use instead of IO.inspect binding():
def some_fun(a, b, c) do
  require IEx; IEx.pry
  ...
end
Once the code above is executed inside an iex session, IEx will ask if we want to pry into the current code. If accepted, we will be able to access all variables, as well as imports and aliases from the code, directly From IEx. While pry is running, the code execution stops, until continue is called. Remember you can always run iex in the context of a project with iex -S mix TASK.
Unfortunately, similar to IO.inspect/2, IEx.pry/0 also requires us to change the code we intend to debug. Luckily IEx also provides a break!/2 function which allows you set and manage breakpoints on any Elixir code without modifying its source:
Similar to IEx.pry/0, once a breakpoint is reached code execution stops until continue is invoked. However, note break!/2 does not have access to aliases and imports from the debugged code as it works on the compiled artifact rather than on source.
Debugger
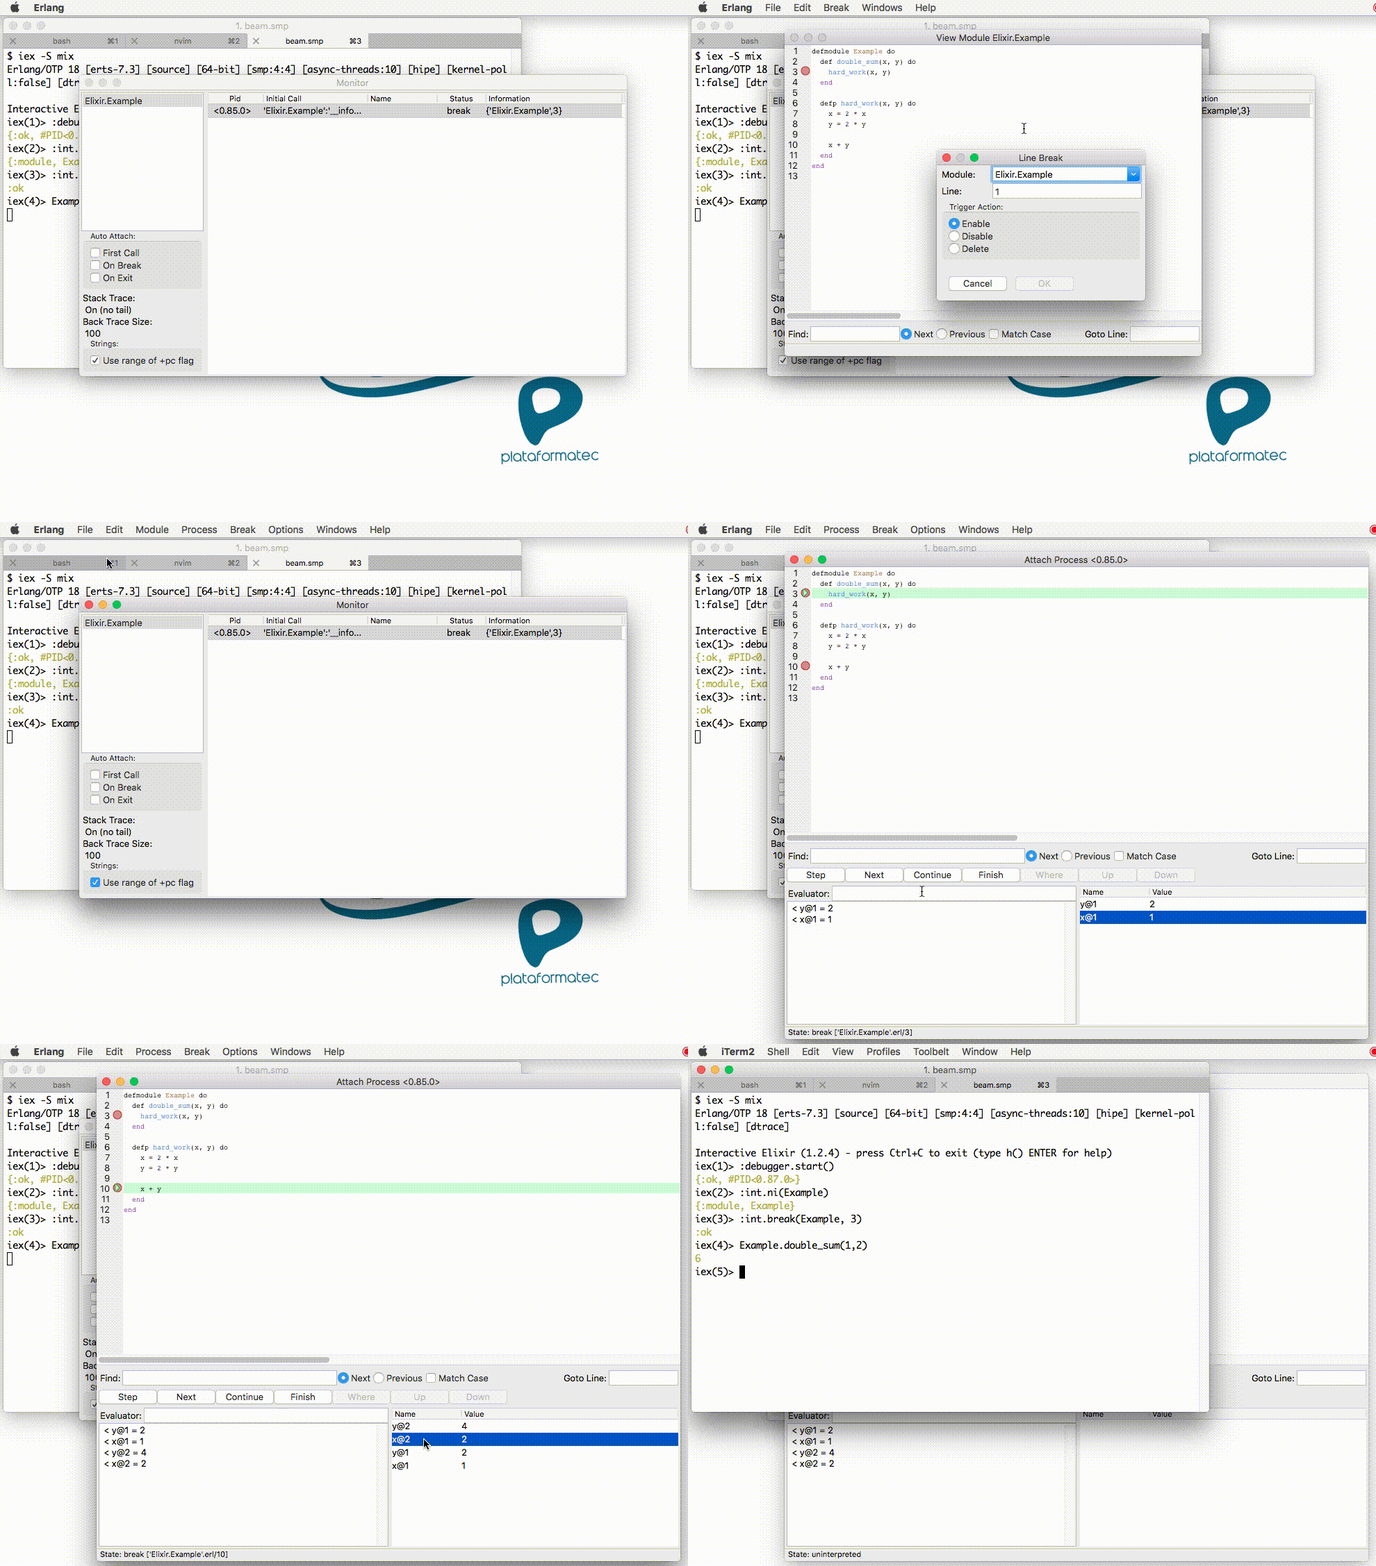
For those who enjoy breakpoints but are rather interested in a visual debugger, Erlang/OTP ships with a graphical debugger conveniently named :debugger. Let’s define a module in a file named example.ex:
defmodule Example do
  def double_sum(x, y) do
    hard_work(x, y)
  end

  defp hard_work(x, y) do
    x = 2 * x
    y = 2 * y

    x + y
  end
end
Now let’s start an IEx session to compile the file and start the debugger:
$ iex
iex(1)> c "example.ex"
[Example]
iex(2)> :debugger.start()
{:ok, #PID<0.87.0>}
iex(3)> :int.ni(Example)
{:module, Example}
iex(4)> :int.break(Example, 3)
:ok
iex(5)> Example.double_sum(1,2)
If the
debuggerdoes not start, here is what may have happened: some package managers default to installing a minimized Erlang without WX bindings for GUI support. In some package managers, you may be able to replace the headless Erlang with a more complete package (look for packages namederlangvserlang-noxon Debian/Ubuntu/Arch). In others managers, you may need to install a separateerlang-wx(or similarly named) package.
When you start the debugger, a Graphical User Interface will open in your machine. We call :int.ni(Example) to prepare our module for debugging and then add a breakpoint to line 3 with :int.break(Example, 3). After we call our function, we can see our process with break status in the debugger:

Observer
For debugging complex systems, jumping at the code is not enough. It is necessary to have an understanding of the whole virtual machine, processes, applications, as well as set up tracing mechanisms. Luckily this can be achieved in Erlang with :observer. In your application:
$ iex
iex(1)> :observer.start()
Similar to the
debuggernote above, your package manager may require a separate installation in order to run Observer.
The above will open another Graphical User Interface that provides many panes to fully understand and navigate the runtime and your project:
We explore the Observer in the context of an actual project in the Dynamic Supervisor chapter of the Mix & OTP guide. This is one of the debugging techniques the Phoenix framework used to achieve 2 million connections on a single machine.
Finally, remember you can also get a mini-overview of the runtime info by calling runtime_info/0 directly in IEx.
Other tools and community
We have just scratched the surface of what the Erlang VM has to offer, for example:
- Alongside the observer application, Erlang also includes a
:crashdump_viewerto view crash dumps - Integration with OS level tracers, such as Linux Trace Toolkit, DTRACE, and SystemTap
- Microstate accounting measures how much time the runtime spends in several low-level tasks in a short time interval
- Mix ships with many tasks under the
profilenamespace, such ascprofandfprof - And more
The community has also created its own tools, often to aid in production, other times in development:
- wObserver observes production nodes through a web interface.
- visualixir is a development-time process message visualizer.
- erlyberly is a GUI for tracing during development.
There are probably many more to come too!
© 2012 Plataformatec
Licensed under the Apache License, Version 2.0.
https://elixir-lang.org/getting-started/debugging.html